Climate and Air Emissions

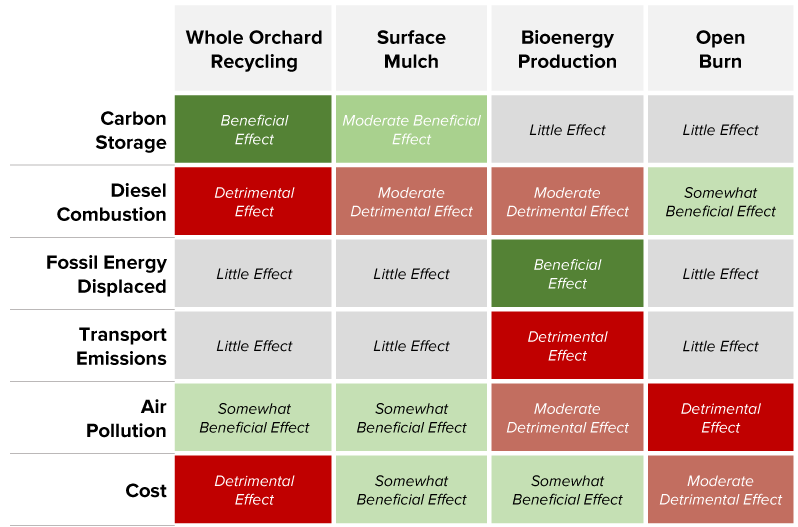
The amount of woodchip biomass added to the soil after whole orchard recycling (WOR) holds great potential to increase carbon storage in the form of soil organic matter. However, it also requires a lot of diesel-burning equipment to make it happen. From the perspective of net emissions of greenhouse gases and other types of pollutants, how does WOR compare to other options for managing end-of-life tree biomass, such as burning or sending wood chips to biomass power plants?

Answering this question requires researchers to use a method known as life cycle assessment (LCA) to estimate the environmental impacts and resources used throughout a product's life, from raw materials extraction to production, and extending through product use and disposal.

Life cycle assessment

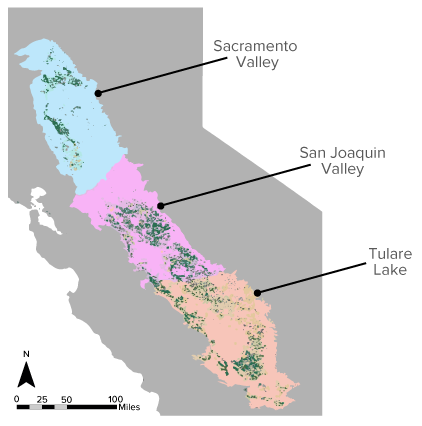
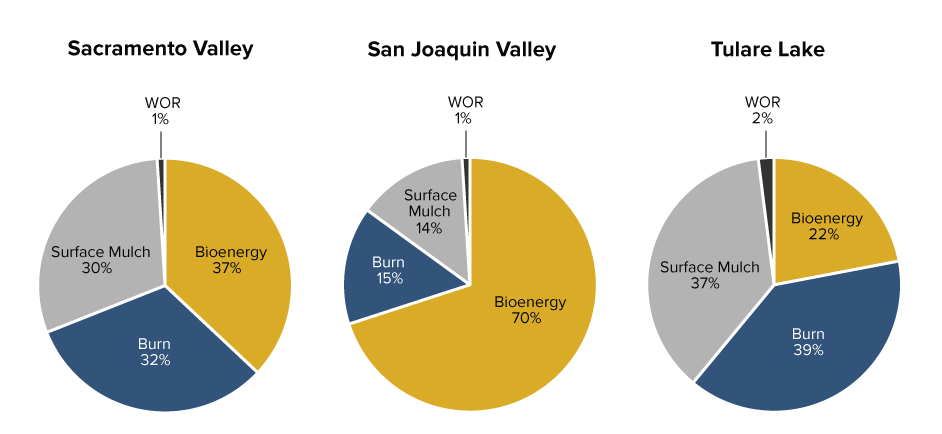
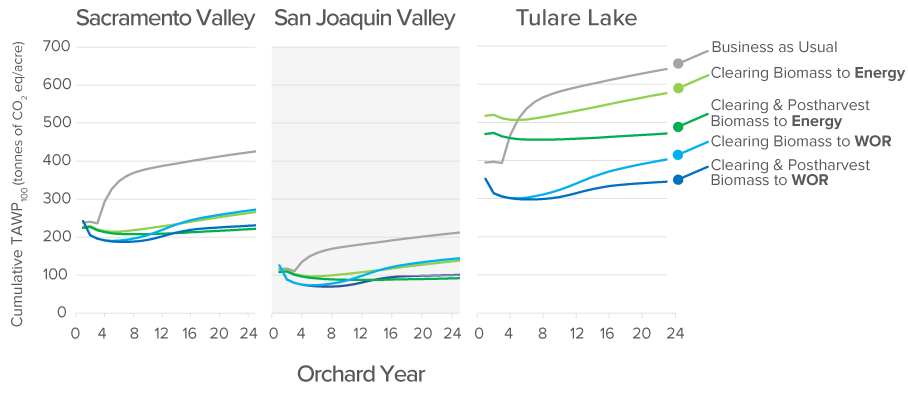
UC Davis researchers used this method to assess the net greenhouse gas emissions and other air and water pollutants arising from the production and use of all materials and energy sources typically required for almond production in California over the orchard lifespan, typically 23–25 years. The researchers compared the net greenhouse gas and pollutant emissions from WOR, surface mulching, in-field burning, and sending wood chips to power generation. Here we focus on the greenhouse gas emissions.

WOR Life Cycle Assessment Methods

To estimate these net emissions, UC researchers used soil carbon data from wood-chip experiments to estimate the effects of WOR compared to other methods of orchard disposal.

Key Stages of Almond Production for this Analysis

  1. Orchard establishment (including nursery production of saplings; soil preparation; planting, irrigation system installation)
  2. Orchard management (including pruning; irrigation; tree replacement; pest control; production, transport, and use of fertilizer and other chemical and material inputs; )
  3. Orchard removal and disposal
  4. Post-harvest processing and handling
  5. Manufacturing and transportation of orchard inputs and products along the entire life cycle

Key Orchard Parameters for this Analysis

  • Analysis is regionally specific for the northern, central, and southern regions of the Central Valley: Sacramento Valley (SV), San Joaquin Valley (SJV), and Tulare Lake (TL), respectively.

  • Orchard lifespan is assumed to be fixed within regions (25 years for SV and SJV, 23 years for TL), and 1 percent of trees are assumed to die annually. Lost trees are replaced only in the establishment phase.

  • Different irrigation systems (drip, microsprinkler, sprinkler, and flood) are modeled independently because they result in differences in both water input (including pumping and pressurization requirements) and direct and indirect nitrous oxide (N₂O) emissions from the field. Hydrology of each region is taken into account using geospatial data and information specific to surface water pumping and conveyance and groundwater depth and pumping energy requirements.

  • Each orchard is assumed to have been established on land previously occupied by an almond orchard, and to be replaced by another almond orchard.

  • The impacts from manufacture of agricultural equipment are excluded because they are unlikely to have a major impact on the results of this analysis, due to the long lifespan and multiple uses of most equipment. This is consistent with the treatment of long-term capital investments in other LCA studies.

  • The impacts from transportation, food, and other activities for field workers are excluded, because it is assumed these impacts would exist regardless of whether these field workers are employed in almond orchards or elsewhere.


Key Orchard Disposal Methods in this Analysis

Open or Field Burning

On-site disposal of orchard waste materials via burning. Biomass includes prunings and blowover as well as orchard removal.

Surface Mulch

On-site disposal of orchard waste materials, including prunings and blowover as well as orchard removal.

Biomass to Energy

Off-site disposal of orchard removal at co-generation plant.

Whole Orchard Recycling

On-site disposal of orchard waste materials, biomass primarily from orchard removal.


Key Almond Production Regions in this Analysis

Map of key almond production regions investigated in the life cycle assessment
Figure A. Map depicting the three major Central Valley almond growing regions. Green indicates almond acreage.

Orchard disposal practices vary across different almond production regions of California, depending on those regions’ infrastructure, growing conditions, and regulatory landscapes.

The researchers used geospatial information to account for these differences and compare WOR’s effects across three almond production regions of California: Sacramento Valley, San Joaquin Valley, and Tulare Lake.

Pie charts depicting the ratio of practices that comprise business as usual conditions for orchard disposal in the three regions.
Figure B. “Business as Usual” orchard biomass disposal practices in the three major Central Valley growing regions. Each pie chart depicts the “average” acre of orchard used in the LCA.


How does WOR impact emissions, carbon storage, and fuel use?

Compared to the other orchard disposal methods, WOR provides the greatest amount of carbon storage. However, WOR also requires higher amounts of diesel consumption than the other methods in order to incorporate chips into the soil (Figure c). 

Several different gases with different heat trapping capacities contribute to global climate change. This study reports emissions and credits in terms a standardized measure known as as the Time Adjusted Warming Potential (TAWP). TAWP accounts for the timing of a greenhouse gas (GHG) emission to or removal from the atmosphere. TAWP can therefore estimate the benefits of temporary storage of carbon dioxide (CO₂) in tree biomass during the lifetime of the orchard, which reduces an orchard’s cumulative global warming impact over time.

In the regional assessments, WOR generally had the lowest global warming potential (i.e. was most beneficial from a global warming perspective) of the orchard disposal practices the researchers assessed (Figure d).

Table depicting the effect of orchard disposal practices on carbon storage, emissions, and cost.
Figure C. Different orchard disposal practices and their effects on emissions, fuel consumption, and cost compared to a Business-As-Usual scenario. Green indicates the practice has a beneficial effect on a particular measure. Red indicates the practice has a detrimental effect on a particular measure. Gray means the practice has a negligible effect on a particular measure. Color intensity depicts the magnitude of that effect.


Plots of time-adjusted warming potential of the different methods in the three production regions.
Figure D. Time adjusted warming potential (TAWP) over 24 years after orchard planting in three key almond production regions in California. TAWP calculates the equivalent amount of CO₂ emitted today that would result in that reduced amount of warming.